Learn to incorporate satellite imagery and geospatial data to expand and strengthen your environmental reporting
Trainers:
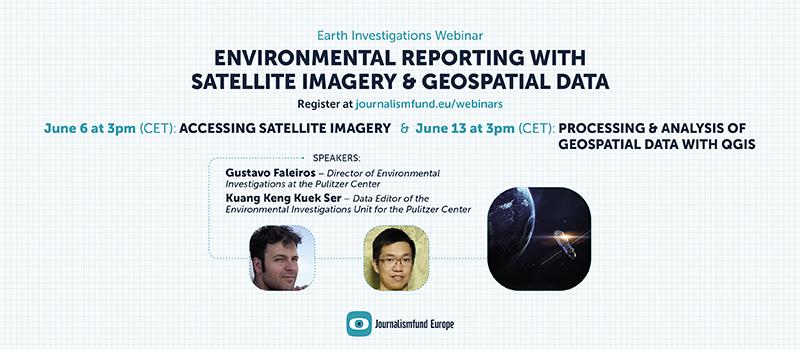
Gustavo Faleiros - Director of the Environmental Investigations for the Pulitzer Center.
Kuang Keng Kuek Ser - Data Editor of the Environmental Investigations Unit for the Pulitzer Center.
Session 1: Accessing satellite imagery
This session introduced the basics of remote sensing, the different approaches to use satellite imagery for investigations and the know-how about gaining access to free satellite imagery via various platforms and tools.
Session 2: Processing & analysis of geospatial data with QGIS
During this session the participants learned about the essential functions and features of QGIS for practical tasks such as calculating and comparing the size of deforestation, checking whether a mine is encroaching on indigenous land, or illegal activities are taking place in regulated areas.
It provided clear instruction on how to open, visualize and manipulate different types of geospatial data, including vector polygons, coordinate points and satellite imagery from different sources.
GENERAL INFORMATION
This was a series of two online sessions that catered to beginners who need an introduction to the world of remote sensing and learn basic steps in accessing online satellite imagery and using QGIS, an open-source geographic information system (GIS) software, to perform simple geospatial analysis for environmental reporting purposes.
The webinars were conducted by editors of the environmental investigations unit at the Pulitzer Center, which supports the Rainforest Investigations Network (RIN) and the Ocean Reporting Network (ORN) in producing in-depth and impactful environmental reporting. Both sessions included references to reports published by RIN fellows and their datasets.
Both sessions were set up to be highly practical and hands-on with step-by-step, follow-along demonstrations of accessing satellite imagery platforms and QGIS.